|
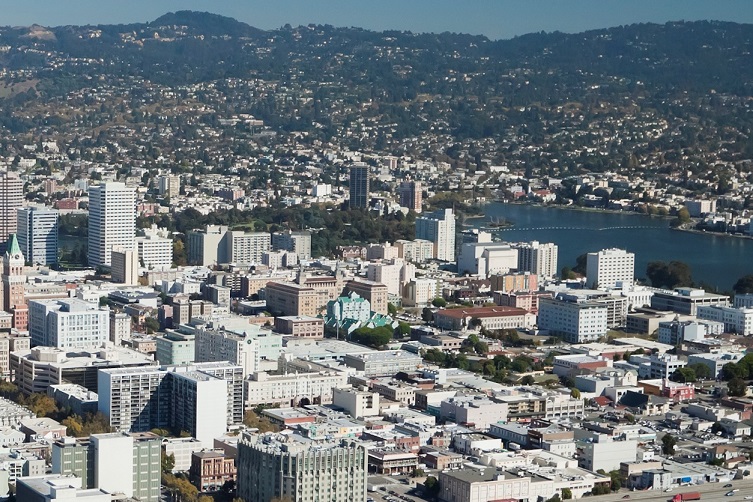
Greater Oakland-Berkeley, Inner East Bay Real Estate |
|
January 2020 Report
———-
|
|
Generally speaking, after years of high appreciation rates, annual 2019 Bay Area median home prices went down a little bit, went up a little bit or basically remained unchanged as compared to 2018. The Inner East Bay house market went up the most, outperforming all other major Bay Area markets.
For 2020, economist Ken Rosen at UC Berkeley has said he expects the Bay Area median price to remain basically flat, within a general range of up or down 2% – in other words, similar to what happened last year. We can’t predict the future, but that doesn’t sound unreasonable, and happily avoids the sensationalism of many other media-grabbing forecasts. Of course, it is certainly possible that the greater Oakland-Berkeley area will continue to exceed the general-region appreciation rate.
|
|
Median sales prices are generalities and not exact measurements of changes in fair market value. They can be affected by a number of factors and are sometimes subject to anomalous fluctuations. How they apply to any particular home is unknown without a specific comparative market analysis.
The Inner East Bay tracked the general Alameda County trend line (below) until this past year or so, when it continued to see median home price increases while the county as a whole saw year-over-year declines.
|
|
Oakland is now seeing a boom in new housing construction, exceeding that in San Francisco. The increase in new apartments and condos being built may affect the supply and demand dynamic in those segments, ameliorating future price increases.
|
|
Economic Factors Affecting Real Estate Markets
|
|
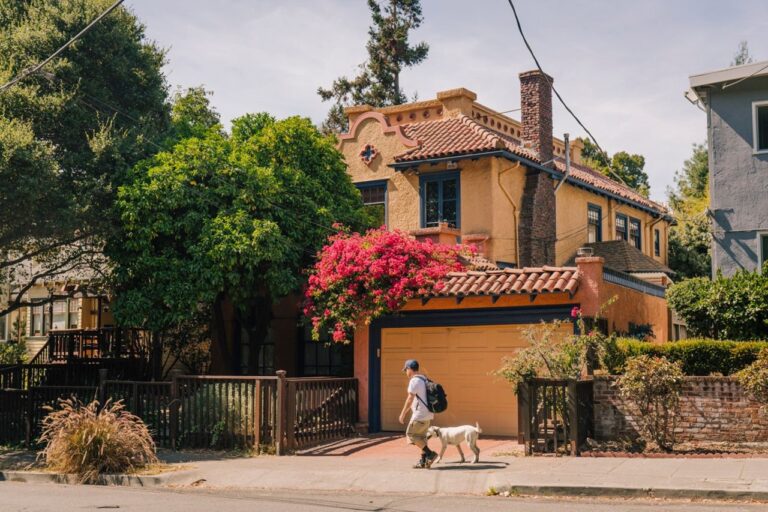
While many local counties are experiencing increasing out-migration of residents and businesses due to a number of issues (including housing costs), the Inner East Bay remains a big destination for people relocating from San Francisco (where the median house price is $1.6 million). The relative affordability of its housing is a major factor in this dynamic. |
|
Greater Oakland-Berkeley, Inner East Bay Real Estate |
|
December 2019 Market Snapshots
|
| Bay Area Home Prices by County |
|
By number of sales, Alameda County is the largest market in the Bay Area. The greater Oakland-Berkeley region constitutes the largest market within the county.
|
|
Bay Area vs. U.S. Appreciation Trends |
|
This next chart estimates percentage home price appreciation trends for the San Francisco metro area (red line) and for the country as a whole (green line). In the latest market up-cycle, which began in 2012, the divergence in trend lines is very dramatic. The chart does not delineate prices, only percentage changes based upon a January 2000 value of 100. Thus 260 = 160% appreciation since January 2000.
|
|
Market Seasonality – New Listings Coming on Market |
|
The market is currently in the midst of its annual plunge in new listing activity, which hits bottom in December. (This chart is updated with data through October. November saw its typical big drop in listing activity.)
|
|
Estimated Home Price Trends since 1996 |
|
The next 3 charts are based upon the calculations of an algorithm which estimates – in a smoothed out, seasonally-adjusted trend line – changes in median home values. According to its calculations, prices in some of our more expensive markets have dropped from recent peaks – a common phenomenon around the Bay Area.
|
|
Market Dynamics by City or District
|
|
As often mentioned in previous reports, many of our cities and districts display statistics indicating them as some of the highest-demand markets in the country.
|
| Regional Market Statistics |
| Greater Oakland-Berkeley Region, Inner East Bay Real Estate Markets |


|
Inner East Bay Real Estate |
|
The Greater Oakland-Berkeley Region Home Prices by City & Neighborhood; Migration In & Out of Alameda & Contra Costa Counties; Price Reductions; Supply & Demand Statistics September 2019 Report
————
|
| After the heat of the spring market, activity typically slows down markedly in July and August. In September, listings start pouring on the market again to fuel the relatively short autumn selling season. What occurs in the next 2-3 months will be the next major indicator of market conditions and direction. |
| Median Home Price Appreciation Trends |
| Except for Piedmont, whose median house sales price was basically flat at about $2,300,000, all the other cities included in our Inner East Bay market have seen median sales price increases in 2019 YTD over those in 2018, though the scale of the increase varies from tiny to substantial. Full-year 2019 median prices may well vary from those for the first 8 months of the year. |
|
Home Prices by City and City Submarkets
|
| The way the local MLS system breaks out submarkets within Oakland and Berkeley – using zip codes and “map areas” – is not ideal, as they don’t correspond that well to specific neighborhoods. But we’ve included the submarket maps, as well as identifying, as best we can, the submarkets with their predominant neighborhoods. |
|
Migration: People Moving In & Out of Alameda & Contra Costa Counties
|
| Using new U.S. Census estimates released 8/29/19, this chart attempts to identify U.S. counties, states and international regions with the highest number of residents migrating to and from our county. In the Bay Area, there is a general trend outward from more expensive to more affordable places, while in-bound migration is deeply affected not only by exchanges between Bay Area counties, but people arriving from other parts of the state, country and world. Areas often have large two-way exchanges of residents, as seen between Alameda and Contra Costa Counties.
Foreign in-migration is a huge issue in the Bay Area, but it will be another year before any impact of new U.S. immigration policy on foreign in-migration in 2018 shows up in census numbers.
|
|
Longer-Term Trends in Alameda County Median House Price Values
|
| As illustrated at the beginning of this report, the cities in the Inner East Bay region have generally seen 2019 YTD median home value increases over 2018, as compared to the small declines seen in Alameda and Contra Costa Counties in their entireties – graphed below. |
|
Longer-Term Trends in Alameda and Contra Costa Median Dollar per Square Foot Values
|
|
Selected County Market Statistics
|
| The inner East Bay market has been outperforming Alameda and Contra Costa Counties as illustrated in the second chart below, in which the the percentage of listings reducing price is broken out for the 2 counties and then just for Oakland.
The first chart below compares Alameda County supply, the number of active listings on the market, with its buyer demand, as measured by the number of sales. This is a seasonally adjusted graph that smooths out normal monthly fluctuations to provide clearer historical trend lines. Again, for the most recent period, the Inner East Bay market, if broken out, would have a significantly smaller gap between listings and sales. |
|
The percentage of listings reducing price in Contra Costa and Alameda Counties, and then just for Oakland (as an Inner East Bay indicator): For the full counties, the percentages jumped in the second half of 2018 and have remained somewhat elevated since. In Oakland, the increase was much less significant, illustrating its higher-demand market.
|
|
The next chart measuring unsold inventory in the 2 counties helps give greater context to market conditions and changes. The ups and downs since 2012 are relatively minor compared to the situation that prevailed during the 2008-2011 market recession, when monthly unsold inventory figures were highly elevated.
|

|
The Greater Oakland-Berkeley, Inner East Bay Market
|
|
Oakland, Berkeley, Piedmont, city of Alameda, Albany, Kensington, El Cerrito & Richmond Sales & Values by City, Market Seasonality, Luxury Home Sales, Market Dynamics by City & District, Foreign Homebuyers
August 2019 Report
——–
|
|
Inner East Bay Sales by Price Segment
|
|
Median House Sales Price Trends by City
|
|
Average Dollar per Square Foot Values
|
| Remember that it’s not only the “quality” of a location that affects dollar per square foot value, it’s the size of the home: All things being equal (which they rarely are) smaller homes will sell for a higher dollar per square foot value than a larger one. Piedmont’s average house size is usually over 3000 square feet, while in Central Berkeley, it is typically below 1500. However, size is only one of many factors at play in home values. |
|
Market Seasonality
|
| Market activity usually slows during the late summer months, then spikes back up for the relatively short autumn selling season. This typically begins with a surge of new listings coming on market in September, fueling fall sales. Come mid-November, activity commonly begins to plunge for the winter holidays, to hit its nadir in December. Of course, homes continue to sell in every season of the year. |
|
Luxury Home Sales
|
|
Market Indicators by City & Neighborhood
|
| Q2 is commonly the most active market of the year, and the statistics below reflect how strong the demand was this past spring.
It is interesting that some of our highest priced markets experienced some of the strongest buyer demand, as illustrated by these standard statistics – something also seen in San Francisco in Q2. This is a switch from recent years, when the heat of the market shifted to more affordable segments.
|
|
The overbidding percentages illustrated below were the highest in the Bay Area, and perhaps in the country.
|
|
Foreign National Home Buying Tumbles
|
|
According to a new report by the National Association of Realtors – based on a survey of its member agents – the purchase of U.S. homes by foreign nationals plunged in the 12 months through March 2019. California, and the Bay Area in particular, have been top destinations for international homebuyers.
|
|
Financial Markets Hit New High
|
| The last 12 months have been an extremely dramatic time for financial markets as illustrated below. The alternating confidence and fear generated by its swings have been considerable factors in real estate markets. A parallel dynamic has occurred with the swings in interest rates. |

|
Oakland, Berkeley, Piedmont & City of Alameda Real Estate |
|
Quantifying the Spring 2019 Market
|
|
Stock markets hit new highs, interest rates hit multi-year lows, unicorn IPOs rolled out in San Francisco, and the greater Oakland-Berkeley real estate market had another very strong spring selling season
July 2019 Q2 Report
|
|
Median Sales Price Trends
|
| Median home sales prices typically fluctuate by season – partly due to the heat of buyer demand and partly due to the seasonal nature of luxury home sales – and it is not unusual for them to peak for the calendar year in Q2.
Year-over-year appreciation rates have clearly declined, but generally remain positive in our market area. Many Bay Area markets have seen small y-o-y median price declines. San Francisco, being at the heart of the spring surge in IPOs, saw the highest year-over-year increase – about 5%.
In the charts below, we separated Piedmont from the other 3 cities, because its home prices are so much higher.
|
|
Home Sales by Property Type & Bedroom Count
|
|
Higher-Price Home Sales, $1.5 Million+
|
| Q2 dominates sales of more expensive homes. This year’s sales volume is similar to the peak hit in spring 2018. |
|
Selected Measurements of Buyer Demand
|
| As illustrated below, the statistics of demand in Q2 2019 compare favorably with the hottest markets of recent years. Spring is typically the most active selling season of the year, and, generally speaking, the market gradually cools down thereafter until hitting its low point at the end of the year during the mid-winter holiday season. |
|
Overpricing: Negative Effects for Sellers & Opportunities for Buyers
|
|
We performed longer-term analyses of the effects of overpricing – as indicated by the need for price reductions before the property sold – on every major market in the Bay Area and the results were uniformly similar. As would be expected, there were dramatic differences in the sales price to list price percentage and time on market before sale. But there were also very substantial differences in the average dollar per square value realized upon sale – and the hotter the market, the larger the percentage decline in dollar per square foot that accompanied price reductions. This is almost certainly due to missing out completely on the sales-price-enhancing effects of overbidding.
So, overpricing lowers values for sellers, which also signifies opportunities for buyers who keep an eye out for price reductions and react accordingly.
The statistics illustrated below for homes that sold without prior price reduction reflect buyers jumping very quickly and bidding fiercely on new listings they deem appealing and fairly priced.
|
|
2-4 Unit Multi-Family Property Values – Alameda County
|
| This is an active market segment in our area. Appreciation trends are similar to those seen in single family homes, partly due to the large increase in rents over the period measured. |
|
We not only mapped Bay Area median house sales prices, but ranked them, lowest to highest. What stands out clearly is that, though our home prices are indeed higher than ever, how much more affordable they are when compared to communities of comparable quality in San Francisco and Silicon Valley. If interested, click on the button link below. The ranking list can be found below the map.
|
|
|
Mortgage Interest Rate Trends
|
| Interest rates fell dramatically from the end of 2018 to multi-year lows in Q2 2019, playing a huge role in the cost of housing for home buyers, and energizing demand. |

|
|

| Oakland, Berkeley, Piedmont & City of Alameda Real Estate |
| Home Prices, Sales & Statistics; Stock Markets; Interest Rates and Unicorns |
| April 2019, Q1 Report |
|
A substantial portion of Q1 statistics reflect new listings and accepted offers occurring during the mid-winter market doldrums (Thanksgiving to mid-January). In November and December 2018, the stock market plunged drastically from its all-time high in September, and interest rates hit their highest point in years: these factors negatively affected buyer demand. Then both turned in dramatically positive directions in early 2019. So, Q1 statistics reflect economic conditions in both Q4 2018 (very negative) and Q1 2019 (very positive). It is also the quarter with the lowest sales volume.
Of all the Bay Area housing markets, the greater Oakland-Berkeley market has cooled the least over the past 3 quarters.
The spring selling season – whose data starts to show up in March, but is mostly reflected in Q2 – is the most active of the year, and often sees the highest rates of appreciation. As always, there are many economic factors at play impacting Bay Area markets, some of which are discussed below.
|
| Year-over-Year & Longer-Term Trends |
| Median Sales Prices |
| This long-term median house sales price trend chart reflects the entire county of Alameda. |
| In the two charts below, we focus on the cities of Oakland, Berkeley and Alameda. Piedmont has a much higher median house sales price ($1 million higher than Berkeley) and a much lower quarterly volume of sales (sometimes 15 or fewer sales): the first means its dynamics are somewhat different than the other cities, and the second means its quarterly statistics are less reliable. However, we do have median price statistics specific to Piedmont if you are interested. |
| Year-over-year quarterly appreciation rates remain extremely strong. In many other Bay Area counties,y-o-y appreciation has dropped to zero, or even turned negative – i.e. their Q1 2019 median prices were below Q1 2018 prices. |
| Selected Market Indicators |
| Overall, our market area has seen much less significant changes in standard statistics of supply and demand than other Bay Area regions. Which does not mean our market is immune to larger economic trends at play around the Bay. Q2 will give us critical data regarding the market’s direction.
The charts below are not only indicators of historical trends, but illustrations of the considerable role seasonality plays in the market. |
| Our overbidding percentages are the highest in the Bay Area – in many other counties, sales prices are now averaging below asking prices. Sales price to list price percentages typically peak during the spring selling season when buyer demand is usually strongest. |
| Against state and national norms, average days on market here in recent years have ranged from relatively low – during the mid-winter slowdown period – to extremely low during the spring selling season. |
| Homes Selling for $1,500,000+ |
| Selected Economic Factors |
| A major factor underlying Bay Area housing markets has been the staggering increase in employed residents since 2010. Outward-bound migration trends of residents and businesses – often citing housing costs as one major motivator – have been an increasing concern in recent years, but for the time being, employment numbers have continued to grow. |
| Financial Markets |
|
A wild ride in stock prices, particularly in high-tech: Prices soared to new peaks in summer-early autumn 2018, plunged drastically in Q4 2018, and then saw the biggest Q1 jump in 20 years. Huge amounts of wealth appearing, disappearing and reappearing – another major influence on consumer confidence and home-buyer demand.
A new surge of large, high-tech unicorn IPOs – mostly of firms headquartered in SF – has just started to roll out. IPOs have historically created vast quantities of new wealth in the Bay Area, though the magnitude of effect of this new wave on specific local housing markets is yet unknown. However, if there is a large impact in SF, there will probably also be a substantial effect in our markets.
|
| New Construction |
| Alameda County took the lead in 2018 for Bay Area homes authorized for construction – most of which are in multi-family projects (apartments and condos). Oakland, in particular, is in the midst of a construction boom. As larger quantities of new housing units are built – there can be a substantial lag between authorization and completion – it affects the supply and demand dynamic in the market. |
| Interest Rates |
| There has been a stunning decline in mortgage interest rates from mid-November 2018 through the end of March, from 4.94% to 4.06% – to the enormous advantage to buyers. Big drops such as this have helped to recharge buyer demand in the past. |
| Housing Affordability & Household Incomes |
| This chart calculates the income required to buy a median-price house in Q4 2018. Median condo prices are substantially less in every county and would require lower incomes. One of the critical factors in our real estate market is its relative affordability compared to nearby SF, San Mateo and Santa Clara Counties. |
| County median household incomes are broken out below for homeowners and tenants. Comparing the chart below to the one above illustrates the disparity between prevailing incomes and the incomes required to purchase in the Bay Area. |
| Health & Economic Indicators |
| According to CountyHealthRankings.org, Bay Area counties are at the top of the list within CA for Overall Health Outcomes: Marin, San Mateo and Santa Clara rank 1, 2 & 3, while Alameda County ranks 12th. (Within larger regions, it is not unusual for more urban areas to have lower rankings than more suburban ones.) |