
BY THAN MERRILL | @THANMERRILL
The Oakland economy has managed to keep pace with the entire state of California, but – through no fault of its own – has failed to keep up with its Bay Area neighbor: San Francisco. That is not to condemn Oakland’s economic standing, but rather identify the strength of San Francisco. In fact, Oakland has made up a lot of ground since the Great Recession. Due largely, in part, to the area’s technology industry, the Oakland housing market has become the beneficiary of heady construction efforts. New construction projects are actually Oakland’s primary source of economic growth.
It would appear as if the Oakland housing market has taken notes on the performance of San Francisco, as an FHFA (Federal Housing Finance Agency) report recently identified Oakland as the metro where home prices rose the most in the United States. At 13.4 percent, the Oakland housing market had the highest spike in home values over the first quarter of this year. According to Zillow, home prices are expected to jump another 7.1 percent in the next year. It doesn’t look like appreciation rates will temper any time soon in the East Bay area.
According to Paragon Real Estate Group, the median house price in the Oakland housing market was $520,000. Despite recent increases in the Oakland real estate market, median home values are considerably less than surrounding areas. Oakland homes are far less than San Francisco homes, which have seen median prices exceed $1,000,000. Oakland’s median was also less expensive than Berkeley, which had a median of $918,000; and Alameda, which had a median of $710,000. So while Oakland real estate is certainly on the rise, surrounding areas have made it difficult for the East Bay city to stand out. Oakland did not have the lowest median in the East Bay, however. With a median of only $330,000; that honor went to Richmond.
Oakland Real Estate Investing Statistics
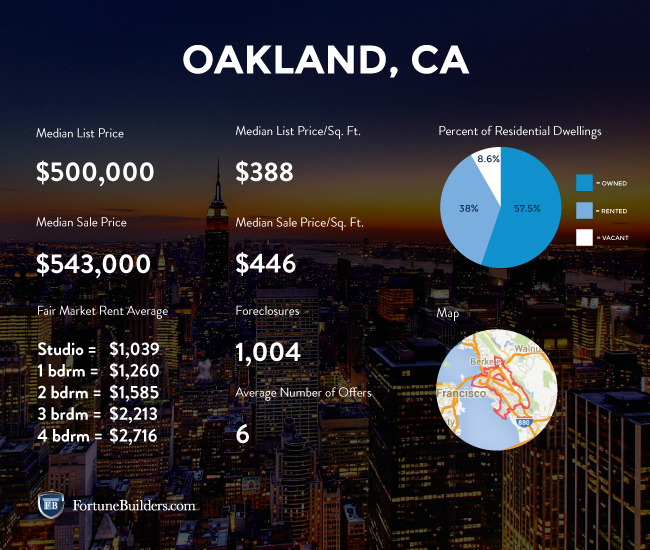
Moving forward, foreclosures will have a huge impact on the direction and pace of Oakland real estate. At the time of this article, there are three homes out of every 10,000 that are in some state of foreclosure. This is greater than the San Francisco Metro value of 1.3 and also lower than the national value of 3.9.
According to Zillow, 5.9 percent of the homes in the Oakland real estate market are delinquent on mortgage obligations, meaning they have failed to keep up with payments. That said, the national average is 6.3 percent. The percent of Oakland homeowners underwater on their mortgage is 9.4 percent, which is higher than San Francisco Metro, which is 6.6 percent.
Data presented by RealtyTrac suggests that the Oakland housing market has about 988 properties in some state of distress. That could mean that the home is in a state of pre-foreclosure, bank-owned or scheduled to be placed up for auction. Nonetheless, these homeowners are at risk of losing their property to foreclosure, or already have. Either way, the Oakland real estate investing community should find ample opportunities in these homes.
Distressed properties in the Oakland real estate market only become more attractive when you factor in the foreclosure discount. That is to say that distressed properties sell for much less than those of a non-distressed nature. The average non-distressed home sells for approximately $444,000. On the other hand, foreclosures have an average sales price of $363,175, or 18 percent lower than non-distressed home sales. That is a savings of more than $80,000 per home. The Oakland real estate investing community should find the spreads offered by distressed properties to be more than attractive.

Of the nearly 1,000 homes in foreclosure, the majority is only at risk of going into foreclosure. About 38.3 percent of homeowners are at risk of losing their properties. Another 31.2 percent have already seen their homes taken by banks, and the remaining foreclosures are scheduled to be placed up for auction. Again, each of these scenarios should benefit the Oakland real estate investing community.
While the Oakland housing market is firing on all cylinders, it is by no means on par with its neighbor to the west: San Francisco. That said, Oakland real estate is keeping up with California trends. Prices are appreciating at high rates, and thanks to the local tech industry, the job sector is able to keep pace. The Oakland real estate market is actually benefiting from the high prices in neighboring areas like Silicon Valley. Oakland is now a cheaper option for industrial and office space. Industry professionals are now realizing this and pushing into Oakland.
The majority of Oakland residents are renters, as 55.2 percent of the housing inventory is currently on lease. Another 36.9 percent of the homes are owner occupied, and the remaining 7.9 percent remain vacant. The Oakland real estate investing community has certainly noticed these trends, and are aware of the need for rental housing. However, while renting in the Oakland housing market is cheaper than in San Francisco, it isn’t by much.
According to SF Weekly, a one-bedroom apartment in San Francisco rents for about $2,824.99 a month, while the same type of unit in the Oakland housing market rents for about $1,514.43 every month. Each is in rare company, as both markets are about as unaffordable as it gets. There is one thing, in particular, that you should know about Oakland before you consider moving there: it is certainly not as cheap as it used to be. While considerably cheaper than San Francisco, the Oakland housing market is still the 11th least affordable city in the United States to rent. It is not uncommon for people in the East Bay to spend about 36 percent of their paycheck on rent. New York tops the list, with cities like San Diego, Chicago, and Boston scattered in.
Oakland Housing Market Summary:
- Current Median Home Price: $520,000
- 1-Year Appreciation Rate: 13.4%
- Unemployment Rate: 5.9%
- Population: 406,253
- Median Household Income: $51,683
Oakland County Map:
*The information contained herein was pulled from third party sites. Although this information was found from sources believed to be reliable, FortuneBuilders Inc. makes no representations, warranties, or guarantees, either express or implied, as to whether the information presented is accurate, reliable, or current. Any reliance on this information is at your own risk. All information presented should be independently verified. FortuneBuilders Inc. assumes no liability for any damages whatsoever, including any direct, indirect, punitive, exemplary, incidental, special, or consequential damages arising out of or in any way connected with your use of the information presented.